GPA Conversion Chart: How to Convert Grades Across Different Scales

·4 min read
A GPA conversion chart is useful because students are often forced to compare grades that were never designed to line up neatly. One school reports percentages, another uses letters, a university transcript shows a 4.0 GPA, and an application portal asks you to convert everything into a single number.
That is where confusion starts. A GPA conversion chart can help, but only if you understand what kind of chart you are looking at and what assumptions it makes.
What a GPA Conversion Chart Actually Shows
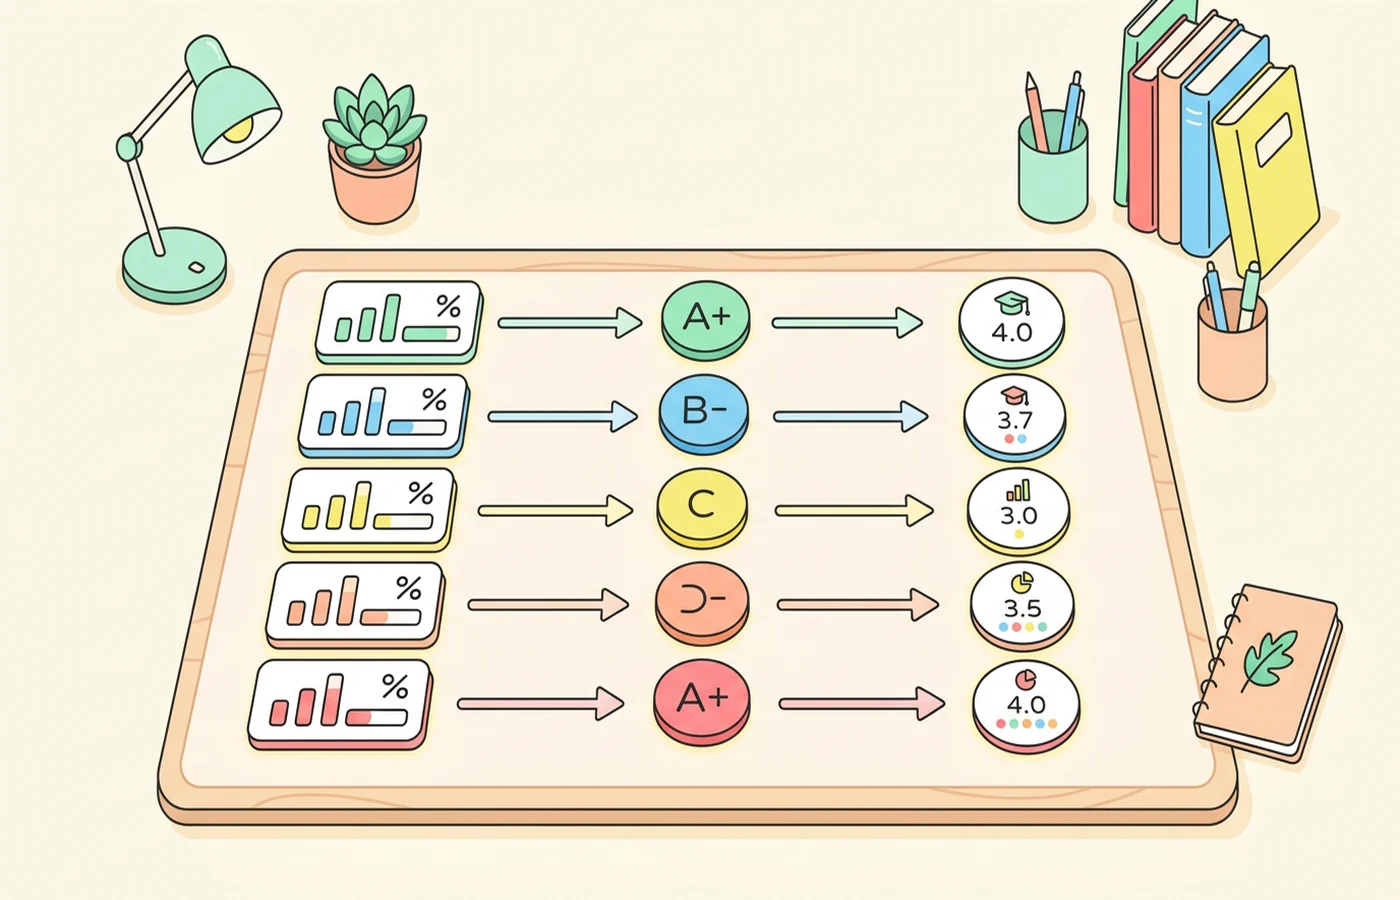
Most GPA conversion charts map one grading system onto another. Common examples include:
- percentage to 4.0 GPA
- letter grade to GPA points
- UK classification or percentage to US-style GPA
- course grade to cumulative GPA estimate
The problem is that there is no single universal conversion standard. Schools, universities, scholarship bodies, and credential evaluators may all use slightly different mappings.
So the first rule is simple: a GPA conversion chart is a guide, not always an official institutional answer.
The Most Common Grade Systems Students Need to Convert
Percentage to GPA
This is common when students study in systems that report raw percentages but apply to programmes asking for a GPA. A 90 percent result may map to a 4.0 in one chart but not in another.
Letter Grades to GPA
This is the familiar US-style scale where A, B, C, and so on map to points such as 4.0, 3.0, and 2.0. Variants may distinguish between A-, B+, and other modifiers.
International Conversion
Students comparing US, UK, Canadian, or European systems often discover that the same raw number can represent very different academic performance. A 70 in the UK, for example, is often much stronger than a 70 on a US percentage scale.
If you are comparing systems, articles like UK grading system, British grading system, and what is GPA can help you interpret the context around the numbers.
Why GPA Conversion Charts Cause So Much Confusion
The core issue is that grading systems reflect local standards, not universal calibration. A conversion chart simplifies a messy reality into an approximate equivalence.
Here is where students usually go wrong:
- assuming every 90-plus average automatically equals 4.0
- using an unofficial chart when an institution has its own policy
- confusing weighted GPA with unweighted GPA
- converting one course grade and treating it like a cumulative GPA
- assuming international percentages mean the same thing in every country
These errors are common because students are trying to make admissions, scholarship, or transfer decisions based on numbers that seem more precise than they really are.
How to Use a GPA Conversion Chart Correctly
- Identify your original grading scale.
- Check whether your target institution publishes its own conversion guidance.
- Confirm whether the request is for weighted or unweighted GPA.
- Convert course grades consistently rather than mixing methods.
- Treat informal charts as estimates unless the institution explicitly endorses them.
If your question is not simply "What number is this?" but "How good is this academically?" then context matters as much as the chart itself. That is why posts like GPA scale and what is GPA remain useful alongside any conversion guide.
A Practical Example
Suppose a student has high marks in a percentage-based system and wants to understand how those results might translate into a 4.0 GPA context.
The right process is not:
- pick a random chart from a search result
- convert one top score
- assume the whole transcript matches that number
The better process is:
- review the full transcript
- convert each class according to one method
- average the results consistently
- compare that outcome against the target institution's expectations
This is less convenient, but it is far more accurate.
What GPA Conversion Charts Cannot Tell You
A chart cannot tell you:
- how selective a school is
- whether your GPA is competitive in a specific admissions pool
- how extracurriculars, essays, or recommendations affect an application
- whether a scholarship body uses its own transcript evaluation system
It also cannot fully capture differences in curriculum difficulty, school grading culture, or grade inflation.
FAQ
Is there one official GPA conversion chart for every school?
No. There is no single universal GPA conversion chart. Many schools and organisations use their own methods, especially for international applicants.
Can I convert UK grades to US GPA with a chart?
You can get an estimate, but you should not assume the result is officially accepted everywhere. UK marks and US GPA scales reflect different grading cultures, so conversions vary by institution.
Is a GPA conversion chart accurate?
It can be useful as a planning tool, but it is often approximate. For applications, transfers, or scholarships, the official method from the receiving institution matters more than a generic online chart.